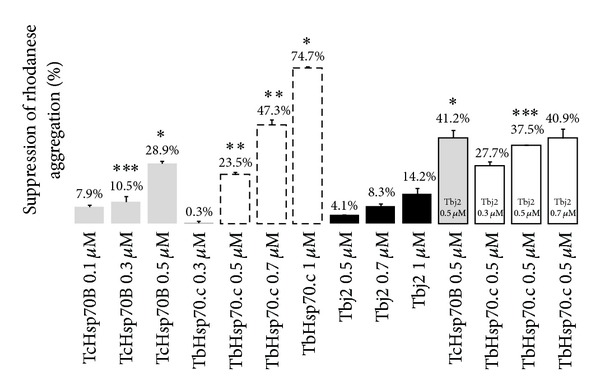
Figure 3.

Suppression of rhodanese aggregation by TbHsp70.c, TcHsp70B, and Tbj2. The rhodanese concentration was maintained at 1.5 µM, the aggregation of denatured rhodanese was measured at 300 nm over 40 min and the concentrations of all components are given in the figure. TcHsp70B, TbHsp70.c, and Tbj2 suppress aggregation of denatured rhodanese in a dose-dependent manner. Each assay was conducted in triplicate and three independent experiments on independent batches of protein were conducted and the data shown represents that of a typical experiment. The bars represent standard deviations. *P < 0.001, **P < 0.01, and ***P ≤ 0.05.
