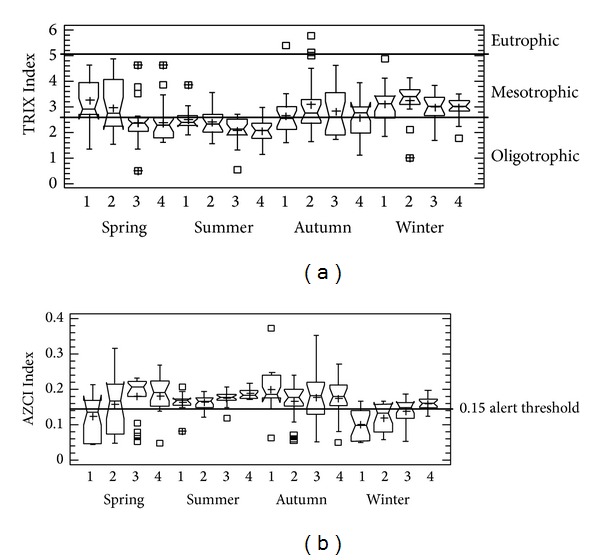
Figure 3.

Box and whisker plot of the (a) TRIX, and (b) AZCI for La Salada Cove during seasons. Numbers 1 to 4 represent the transects. Median, quartiles, ranges, and outliers of data are shown for each event. It shows levels of trophic state and water quality influences from urban sewage inputs.
