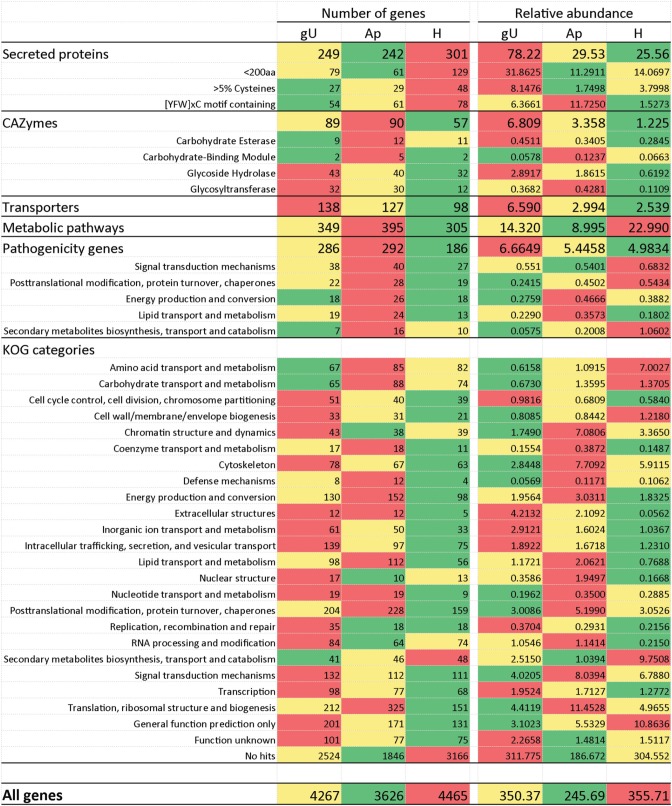
Figure 2.
Heatmaps of the number of genes and sum of their relative abundance values (= number of transcripts/transcript length) in the three libraries (germinating urediniospores, gU; appressoria, Ap; infected leaves 21 days after inoculation, H) for transcripts according to the main categories under analysis. Color scale: green to red denote lowest to highest expression values for each gene.

