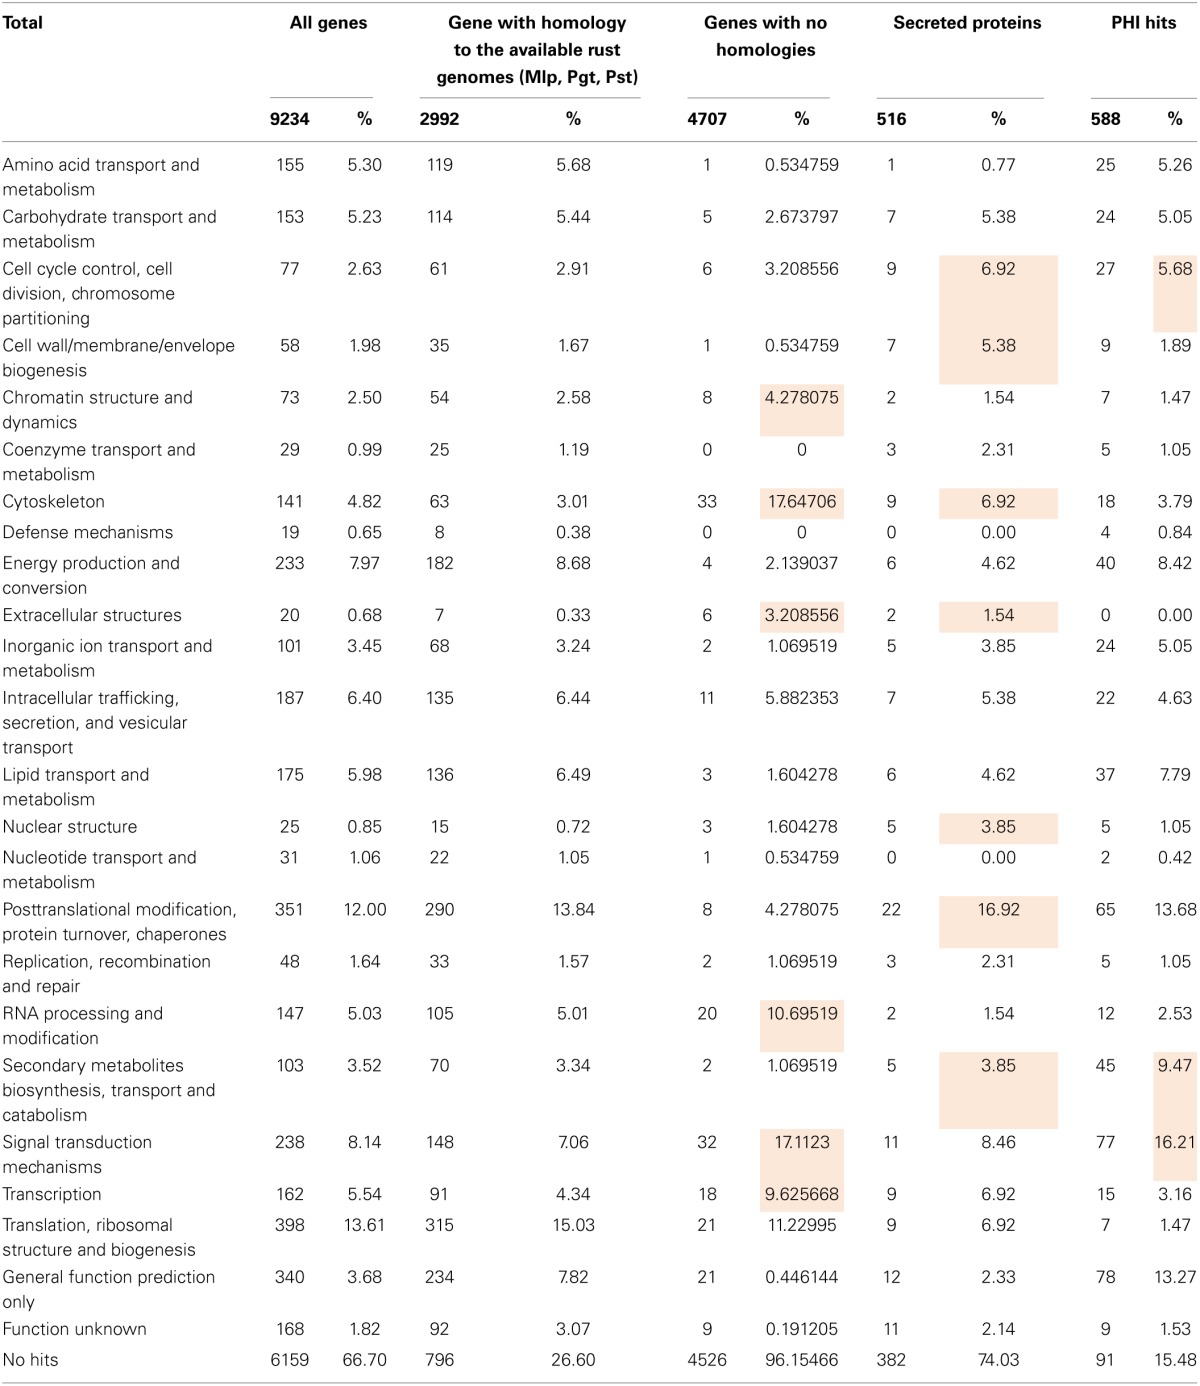
Table 4.
Distribution of Hemileia vastatrix genes by KOG categories considering all genes and different groups of genes according to their homology or predicted function.

For the non-specific categories (“No hits,” “Function unknown” or “General function prediction only”), % refers to the total number of genes. For the remaining categories, % refers to the total number of genes with specific KOG categories assigned; highlighted cells correspond to information that is referred to in the article.
