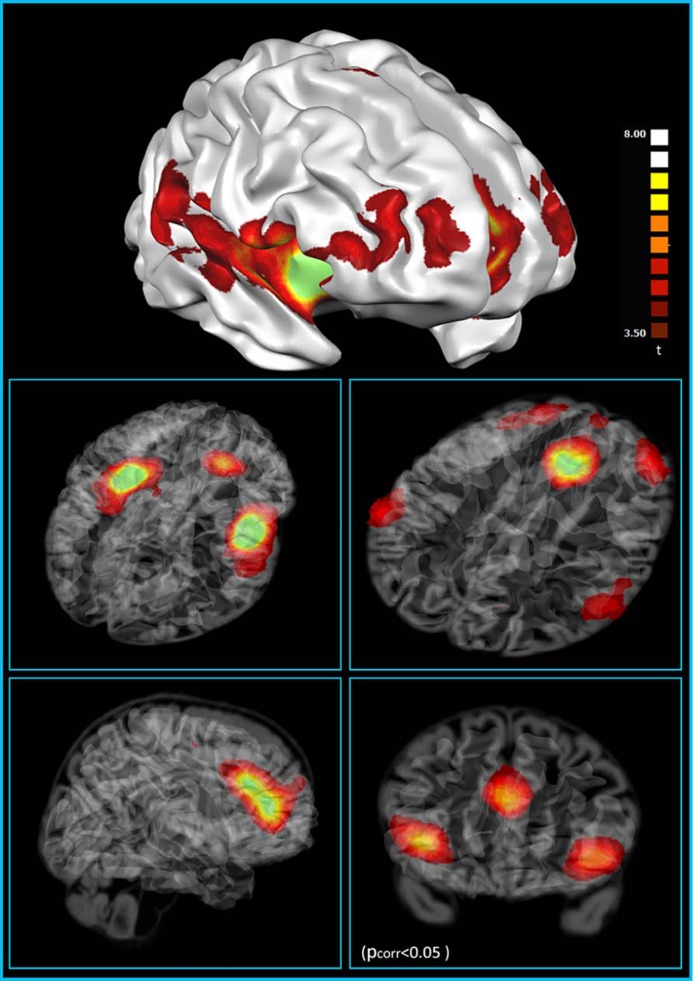
FIGURE 2.
Resting state functional connectivity of the VEN-containing areas (one sample t-test, corrections for multiple comparisons performed at the cluster level using a Monte Carlo simulation; p < 0.05), leading to a cluster threshold k > 22 voxels in the native resolution; maps are projected on a 3D average brain with use of the Brainvoyager QX surface tool (from Cauda et al., 2012).

