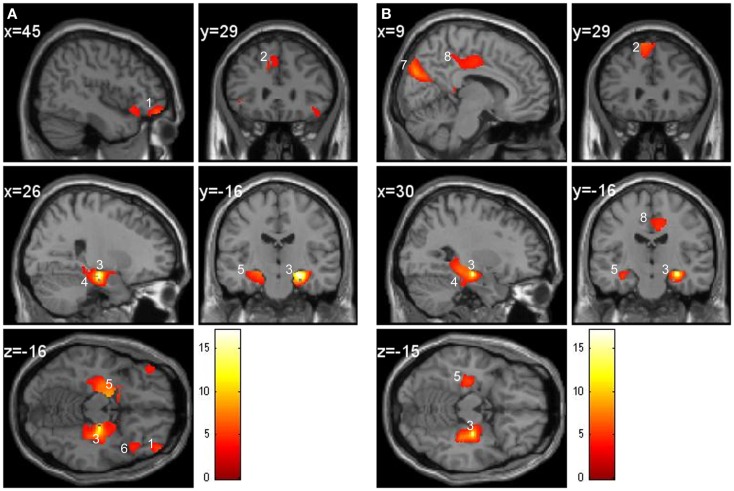
Figure 4.
Regression at the seed voxel of the right hippocampus (24, −21, −15) in controls (A) and in patients (B). The t maps are superimposed onto an anatomical brain and displayed in the sagittal, coronal, and horizontal planes. (A) Right hippocampus (region 3) in controls covaries significantly with the frontal middle orbital cortex (region 1), superior medial gyrus (region 2), right parahippocampal cortex (region 4), and left hippocampus (region 5). Inferior orbital cortex (region 6) does not significantly correlate with the right hippocampus. (B) Right hippocampus (region 3) of patients covaries significantly with the cuneus (region 7), middle cingulate gyrus (region 8), superior medial frontal gyrus (region 2), parahippocampal cortex (region 4), and left hippocampus (region 5).

