
Fig. 4.
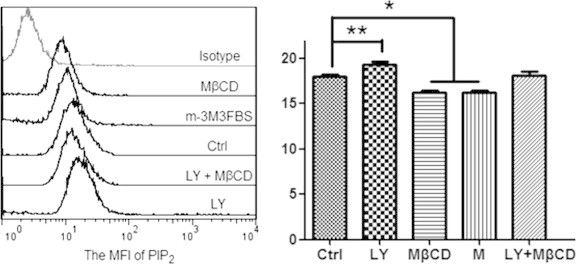
Flow cytometric data shows the different effects of various reagents on the mean fluorescence intensity (MFI) of PIP2 on HUVECs. Left panel: a representative of more than three experiments. Right panel: the statistical histogram of MFI (∗p < 0.05, ∗∗p < 0.01 compared with the control).