
Fig. 5.
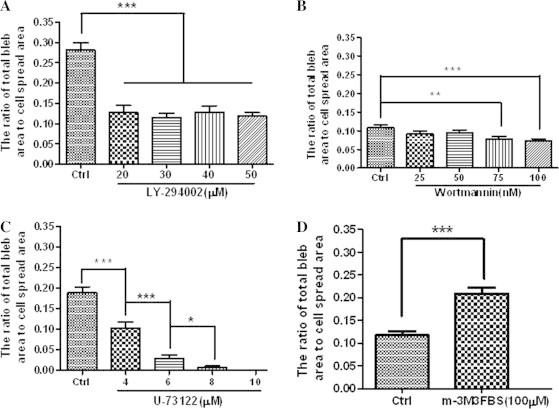
Effects of various reagents at different concentrations on fixation-induced blebbing of spread HUVECs. The Y axis of each graph shows the average area ratio calculated from the ratio of the sum of the largest cross-sectional areas of all fixation-induced blebs on each cell to the spread area of the same cell. HUVECs were pre-treated with or without various reagents and then fixed with 4% paraformaldehyde at room temperature for 30 min. (A) LY294002 (0, 20, 30, 40, or 50 μM for 30 min); (B) wortmannin (0, 25, 50, 75, 100 nM for 1 h); (C) U-73122 (0, 4, 6, 8, 10 μM for 30 min); (D) m-3M3FBS (0 or 100 μM for 2 min). The number of cells measured in each group are indicated in Table 1 (∗p < 0.05, ∗∗p < 0.01, ∗∗∗p < 0.001 compared with the control or as indicated).