
Figure 13.
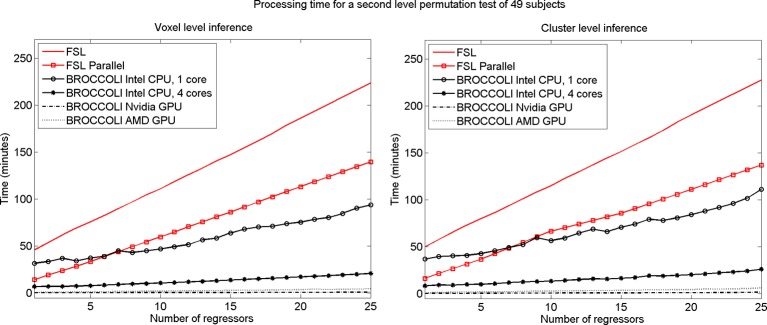
Processing times for second level analysis using a permutation based t-test with 10,000 permutations, for BROCCOLI and FSL (the SPM and AFNI software packages do not provide any functions for permutation based analysis). Left: Voxel-level inference, the maximum t-test value is saved in each permutation. Right: Cluster-level inference, the extent of the largest cluster is saved in each permutation. A t-value of 3 was used as a cluster defining threshold. The data used are beta volumes from 49 subjects, where each beta volume is of the size 91 × 109 × 91 voxels. A brain mask was used to only perform the statistical calculations for the brain voxels. The processing time for FSL increases quickly with the number of regressors, while the processing time for BROCCOLI increases much more slowly. This is explained by the fact that calculations on a GPU are efficient, once all the data have been loaded from the slow global memory to the fast thread specific registers. To estimate several beta weights per voxel, instead of a single weight, therefore results in a better utilization of the GPU performance. The processing time for BROCCOLI using an AMD GPU is 2–5 times as high compared to BROCCOLI using a Nvidia GPU. One possible explanation for this is that the code was converted from CUDA to OpenCL. Note that these processing times are for data normalized to a 2 mm3 MNI template. The permutation tests would take approximately eight times longer for data normalized to a 1 mm3 MNI template.