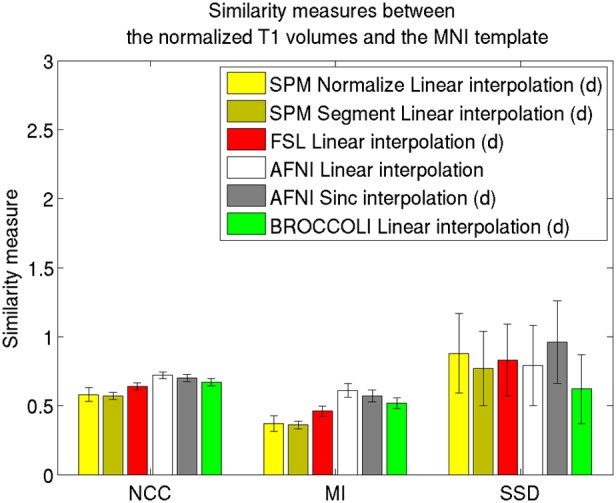
Figure 4.

Similarity measures between each normalized T1 volume and the MNI template for the different software packages, averaged over 198 subjects. The error bars represent the standard deviation. NCC stands for normalized cross correlation (higher is better), MI stands for mutual information (higher is better) and SSD stands for sum of squared differences (lower is better). For visualization purposes, the SSD similarity measure was divided by 300,000. Only the voxels in the MNI brain mask were used to calculate these similarity measures, as 75% of the voxels are outside the brain. Different interpolation modes were tested, as the software packages have different default settings for interpolation (d denotes the default interpolation).
