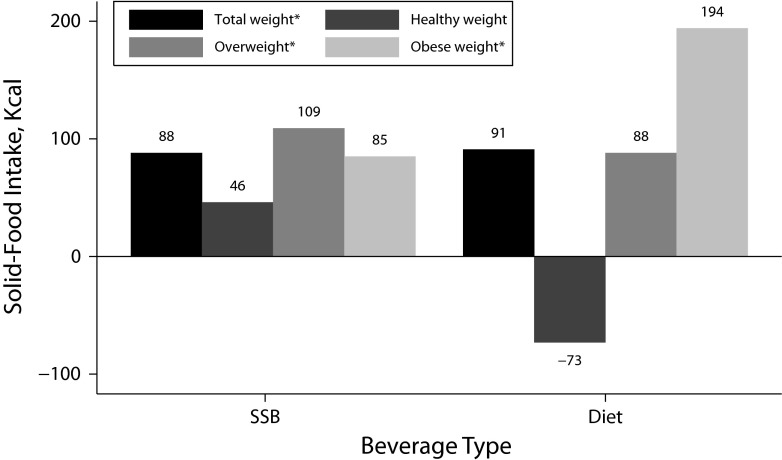
FIGURE 1—
Net change in solid-food intake associated with drinking sugar-sweetened beverages (SSB) and diet beverages among US adults (aged ≥ 20 years) by weight status: National Health and Nutrition Examination Survey, 1999–2010.
Note. Diet = diet beverage; SSB = sugar-sweetened beverage.
*P = .05.

