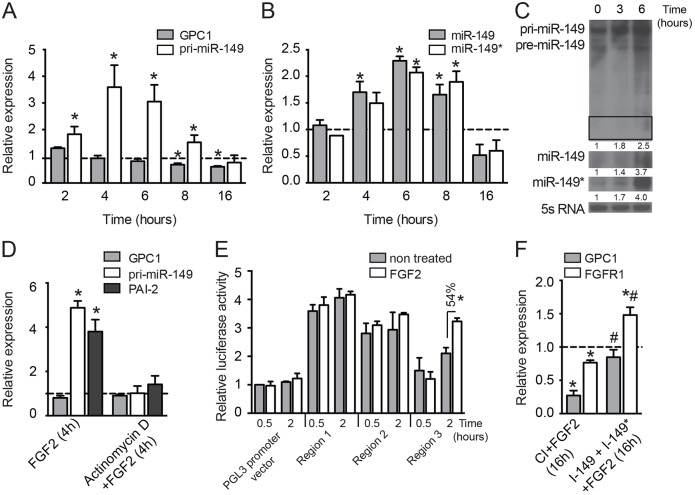
Fig. 5.
FGF modulates miR-149 and miR-149* expression in ECs. (A–C) HUVECs were starved for 12 h and then treated with FGF2 (25 ng/ml) or left untreated for the indicated times. qRT-PCR analysis of (A) GPC1 and pri-miR-149 expression or (B) miR-149 and miR-149* expression. Data are shown as expression relative to non-treated cells and correspond to mean±s.e.m. of five experiments. (C) Northern blotting of pri-miR-149, miR-149 and miR-149* expression. The inset corresponds to miR-149 expression and an overexposed blot is shown below. 5S rRNA is used as loading control. (D) HUVECs were starved for 12 h and then treated for 2 h with actinomycin D (4 ug/ml) prior to FGF2 (25 ng/ml) stimulation for the times indicated. qRT-PCR analysis of GPC1 and pri-miR-149 expression. Data are shown as expression relative to non-treated cells and correspond to mean±s.e.m. of three experiments. (E) Luciferase activity in HUVECs transfected for 5 h with different promoter regions (supplementary material Fig. S1C). Data are shown as luciferase activity relative to control samples transfected with pGL3 promoter vector in basal conditions, and correspond to the mean±s.e.m. of three experiments performed in triplicate. *P≤0.05 compared with cells transfected with the same promoter region upon FGF stimulation. (F) HUVECs were transfected for 48 h with a CI or I-miR-149 plus I-miR-149*, then cells were starved for 12 h and treated with FGF2 (25 ng/ml) as indicated. qRT-PCR analysis of GPC1 and FGFR1 expression. Data are shown as expression relative to non-treated cells and correspond to mean±s.e.m. of three experiments. *P≤0.05 compared with non-treated cells; and #P≤0.05 compared with cells transfected with CI and treated with FGF2.

