Fig. 7.
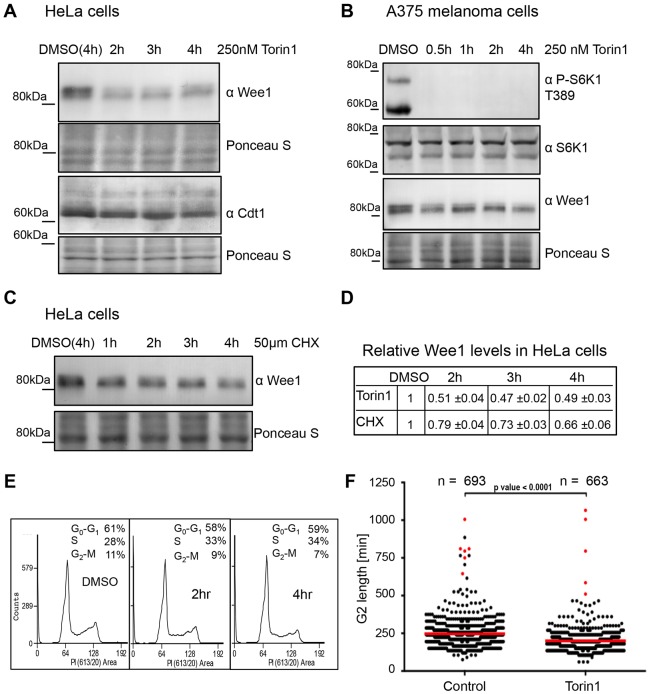
mTORC1 inhibition advances mitosis, as Wee1 is lost. (A) HeLa cells were treated with 250 nM Torin1 and samples harvested at the indicated time points and analysed by western blot using the indicated antibodies. (B) A375 cells were treated with 250 nM Torin1 and analysed by western blot. (C) Cycloheximide (CHX) treatment of HeLa cells. (D) Quantification of A and C. (E) HeLa cells were treated with 250 nM Torin1 and DNA content was analysed by flow cytometry. (F) HeLa Kyoto cyclin-B1–Venus−/+ mRuby–PCNA−/+ H3.3–CFP cells were treated with 250 nM Torin1 or solvent (DMSO). Cell cycle progression was analysed by time-lapse microscopy using mRuby–PCNA marker. G2 length in individual cells was measured from the time point when the PCNA foci form. Red lines are mean values of four independent experiments; red dots represent cells that were in G2 phase until the end of experiment.

