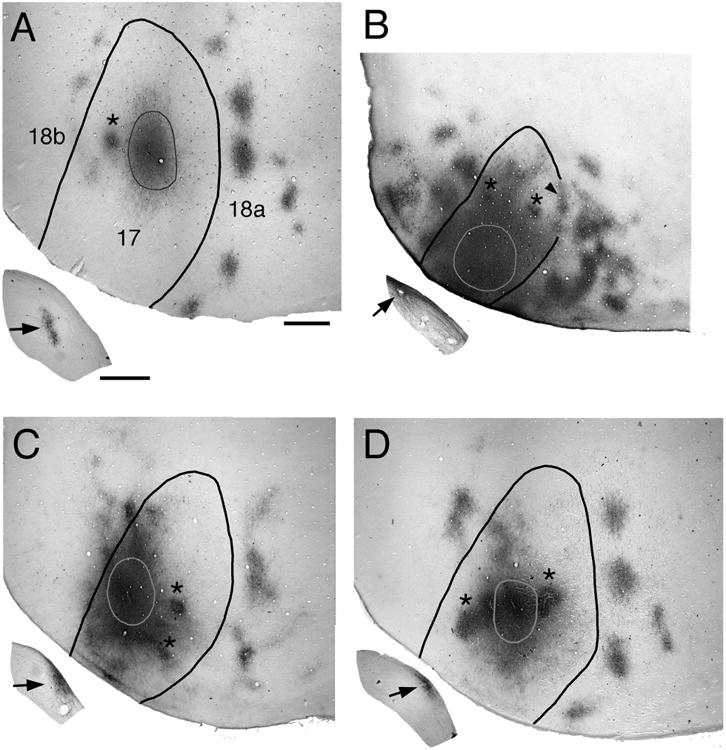
Figure 1.

Effect of bilateral enucleation at different postnatal ages on the pattern of striate–extrastriate projections. Photographs of tangential tissue sections cut through the flattened occipital cortex illustrate the anterogradely labeled projection patterns in extrastriate cortex (areas 18a and 18b; Krieg, 1946; Caviness, 1975) resulting from a single injection of BDA into medial, acallosal regions of striate cortex (area 17). Lateral is to the right, anterior is up. Outlines inside area 17 indicate the injections of the tracer BDA. Asterisks indicate artifactual staining produced by injections of fluorescent tracers. Black arrows in insets indicate the patterns of anterogradely transported BDA labeling in the ipsilateral dLGN. A: Control animal. B: Enucleation at postnatal day 0 (BE0). Arrowhead indicates labeling at the 17/18a border. C: Enucleation at postnatal day 4 (BE4). D: Enucleation at postnatal day 6 (BE6). Scale for flattened tissue = 1.0 mm; scale for dLGn = 0.5 mm.
