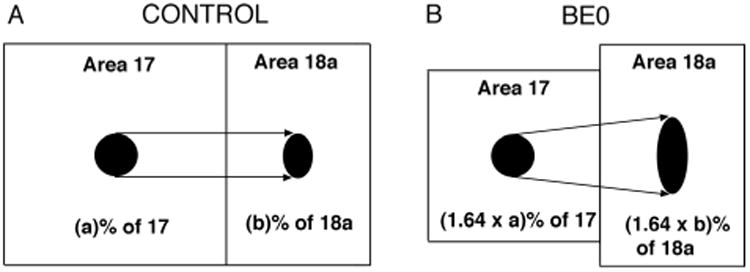
Figure 10.

Diagram summarizing the effects of BE0 on the sizes of areas 17 and 18a, and on the relation between the overall proportion of area 18a occupied by BDA labeling and the proportion of area 17 occupied by the BDA injection. The diagram illustrates that, on average, BE0 causes a 39% reduction in the size of area 17, while it does not have a significant effect on the size of area 18a. The BDA injection in area 17 of the control case (A), represented by the black circle, occupies (a)% of area 17, while in the BE0 case (B), the proportion of area 17 occupied by an injection of the same size increases by a factor of 1.64 due to the reduction in the size of area 17. For example, if the injection site occupied 10% of area 17 in the control rat, an injection of the same size would occupy 16.4% of area 17 in the B0 rat. Similarly, the proportion (b%) of area 18a occupied by the projection from area 17 in control rats (black oval in area 18a, panel A) increases by the same factor in area 18a of BE0 rats (black oval in area 18a, panel B). Thus, the diagram in B illustrates that, for an injection of the same size, the absolute size of the BDA labeling in area 18a is greater in BE0 than in control rats (cf. black ovals in areas 18a in A,B), indicating that enucleation leads to an increase in the divergence of the projections from 17 to 18a.
