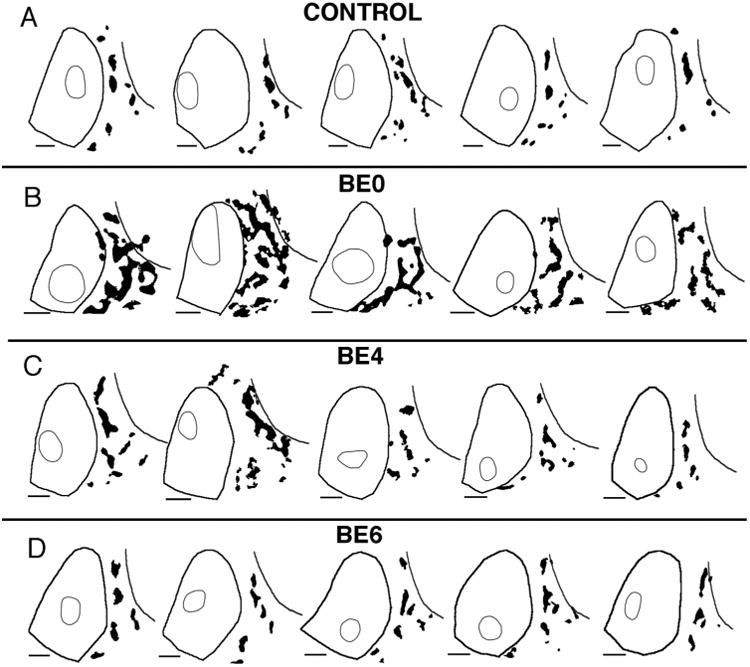
Figure 3.

Patterns of BDA-labeled projections from striate cortex to area 18a in control rats and in rats enucleated at different ages. Lateral is to the right, anterior is up. Thresholded versions of the projection patterns are represented in black. Thick lines delineate the borders of areas 17 and the lateral border of area 18a, while thin outlines outline the BDA injection sites. The injection outlines were drawn at the perimeter where an abrupt transition in the labeling density was observed (see Materials and Methods). The patterns were scaled so that the profile of area 17 in each case matched the profile of area 17 in the first case shown in A as closely as possible. A: Control rats. B: Rats enucleated at birth (BE0). C: Rats enucleated at postnatal day 4 (BE4). D: Rats enucleated at postnatal day 6 (BE6). Scale bars = 1.0 mm.
