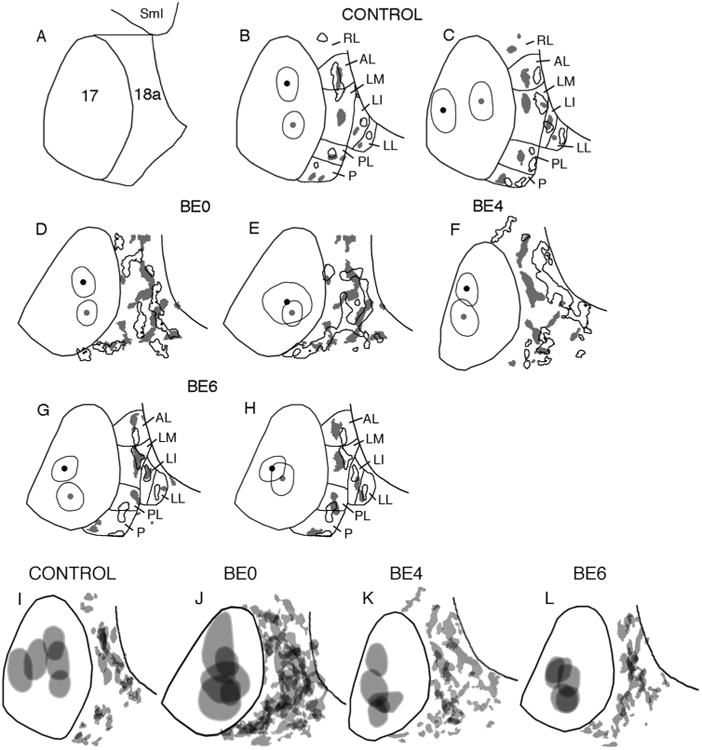
Figure 4.

A: Diagram illustrating the borders of area 18a in both control and enucleated rats, as defined by criteria used in this study (see Materials and Methods). Lateral is to the right, anterior is up. B–H: Comparison of 18a projection patterns from pairs of animals with BDA injections in different loci within striate cortex. Black outlines in area 18a indicate projections from injection sites marked by black dot and thin outline in area 17; gray patches in area 18a indicate projections from injection sites marked by gray dot and thin outline in area 17. Lateral border of area 18a is indicated by black line. Control (B,C); BE0 (D,E); BE4 (F); BE6 (G,H). I–L: Variability of the patterns of projections from striate cortex to lateral extrastriate cortex in control (I) and enucleated rats (J–L). The injection sites within striate cortex and the striate–extrastriate projection patterns in each group shown in Figure 3 were merged after their orientation had been adjusted so that the lateral border of striate cortex coincided as closely as possible within each group. The lateral border of area 18a is indicated by a black line. SmI, Somatosensory cortex; lateral extrastriate visual areas are named as reported previously: RL, rostrolateral; AL, anterolateral; LM, lateromedial; LI, laterointermediate; LL, laterolateral; PL, posterolateral; P, posterior (Olavarria and Montero, 1981, 1984, 1989; Espinoza and Thomas, 1983; Thomas and Espinoza, 1987; Montero, 1993; Coogan and Burkhalter, 1993; Wang and Burkhalter, 2007); other conventions as in Figure 3.
