Figure 7.

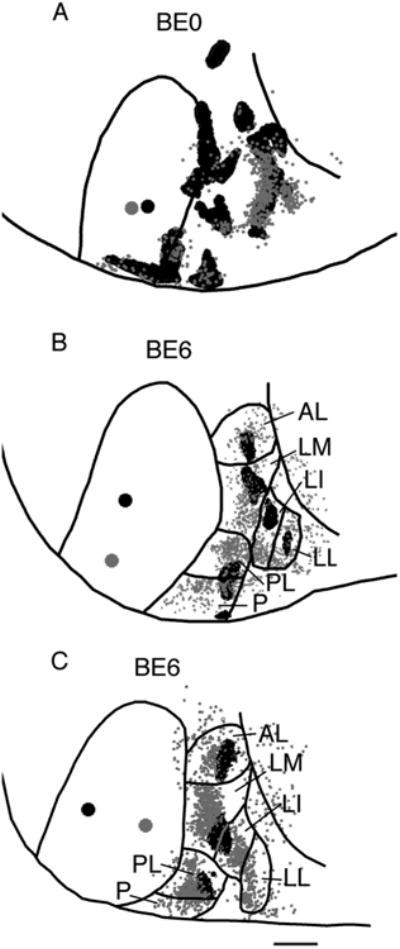
Feedforward and feedback patterns of connections in area 18a of rats enucleated at P0 (BE0) (A) and P6 (BE6) (B,C). Lateral is to the right, anterior is up. Lateral border of area 18a is indicated by a black line. Large black dot in striate cortex represents a single injection of BDA, while the gray dot represents a single injection of rhodamine latex beads. Anterograde projections in area 18a are represented by the black areas, while the small gray dots represent cells labeled retrogradely by the transport of rhodamine latex beads. Visual areas are named as in Figure 4. Scale bar = 1.0 mm.
