
Figure 8.
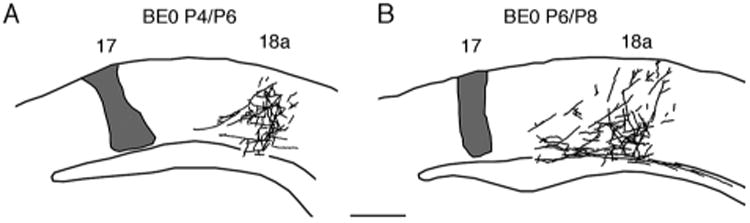
Development of 17–18a projections in rats enucleated at birth. Lateral is to the right. Projections were studied following single injections of BDA into area 17 and the distribution of anterogradely labeled fibers was studied 48 hours later in coronal sections cut through occipital cortex. The injection site is represented in gray and labeled fibers are represented as black lines. A: Case injected at P4 and studied at P6. B: Case injected at P6 and studied at P8. Scale bar = 0.5 mm.