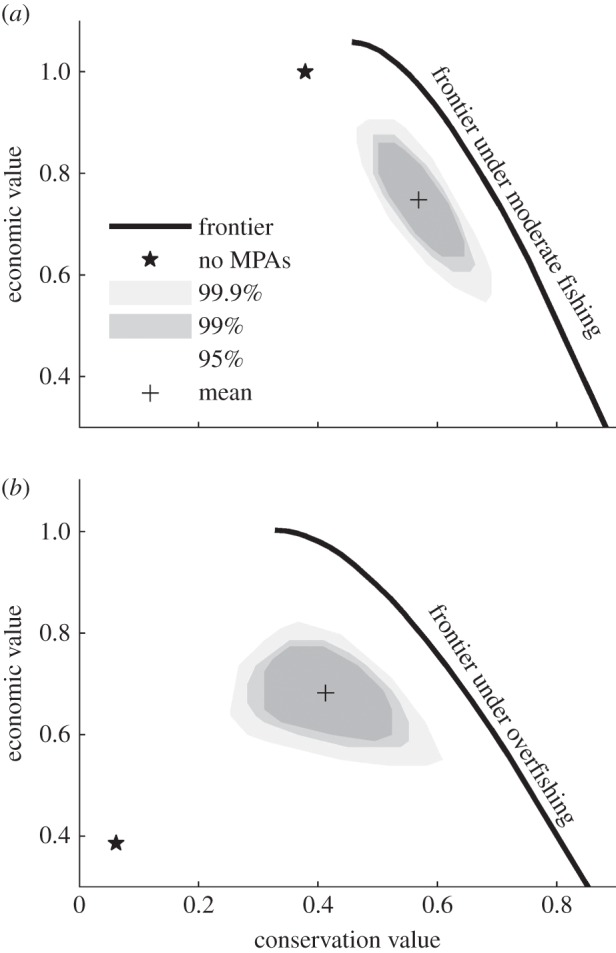
Figure 1.

The effect of MPA network choice on conservation and economic outcomes under (a) moderate fishing and (b) overfishing. The star identifies the outcome with no MPAs. The black curve traces combinations of economic and conservation outcomes available with optimally placed MPAs. The areas contain 95%, 99% and 99.9% of all possible MPA networks, as indicated, and the cross indicates the expected outcome, averaged over all possibilities. Results are based on a model of near-shore fisheries in southern California.
