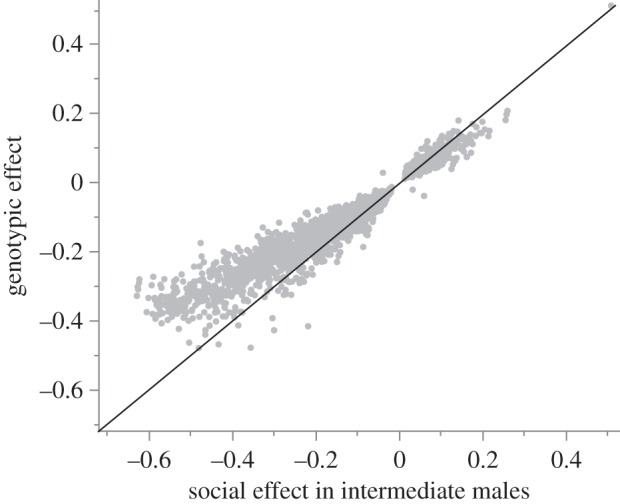
Figure 2.

Social and genetic regulation of gene expression. The x-axis shows the difference in transcript abundance across social contexts in intermediate males, illustrating social regulation; the y-axis shows difference in transcript abundance between intermediate and small males when tested alone, illustrating genotypic regulation. Expression differences are standardized by mean abundance of each transcript such that values represent a proportion of mean transcript abundance. Grey points are transcripts significantly DE in both contrasts, based on permutation tests. Black line indicates equivalent differential expression in both contrasts. Most points fall above this line, illustrating the tendency for individual transcripts to show larger effects of genotypic than of social regulation.
