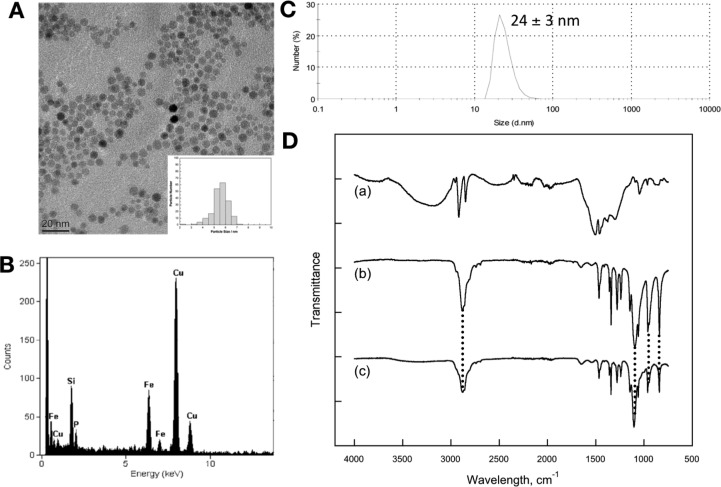
Figure 1.
Characterization of PEG(5)-BP-USPIO: (A) TEM micrograph of a dispersion in water. Scale bar is 20 nm wide. Inset is a histogram of the diameter of 200 particles (DTEM = 5.5 ± 0.7 nm); (B) EDX spectrum showing the presence of iron and phosphorus in the sample; (C) DLS showing a hydrodynamic diameter of 24 ± 3 nm; (D) IR spectra of (a) oleylamine-USPIOs, (b) PEG(5)-BP, (c) PEG(5)-BP-USPIO. Drop lines indicate the vibrations associated with PEG mentioned in the text.

