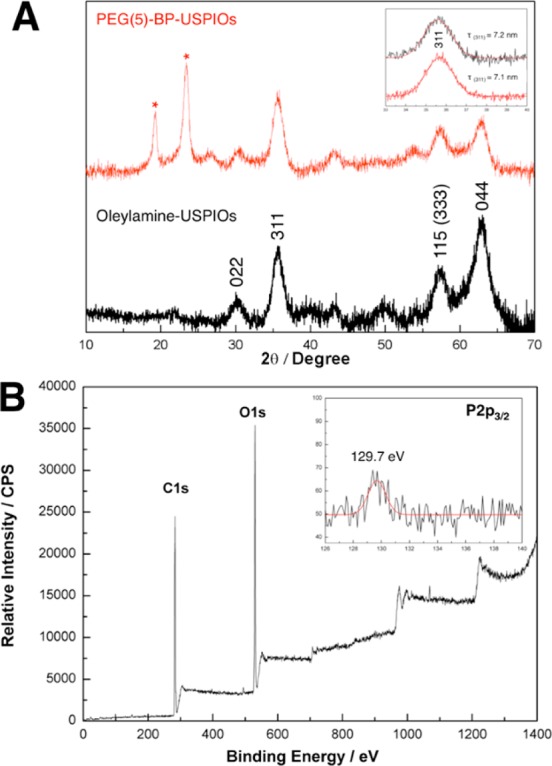
Figure 2.

Characterization of PEG(5)-BP-USPIOs. (A) XRD patterns of oleylamine-USPIOs (bottom, black) and PEG(5)-BP-USPIOs (top, red). Peaks corresponding to iron oxide were labeled with their corresponding planes. The inset shows the peak corresponding to the (311) plane and its mean size (τ(311)) calculated using the Scherer equation. The peaks corresponding to PEG(5)-BP (2θ = 19.2° and 23.3°) have been labeled with an asterisk. (B) XPS spectrum of PEG(5)-BP-USPIOs. The full spectrum shows dominant C1s and O1s signals from the PEG chains on the surface (for a detailed spectrum see Supporting Information). Inset shows the weak but detectable P2p3/2 signal arising from the BP group.
