
Figure 4.
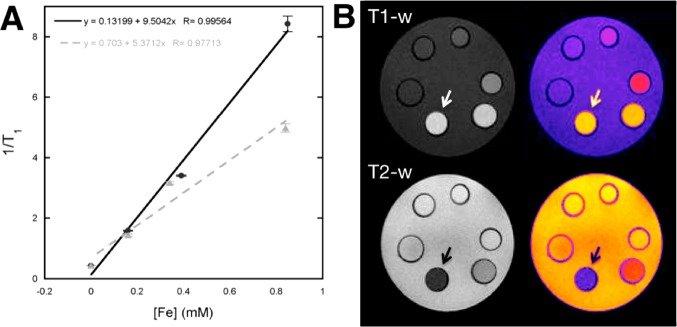
In vitro MRI studies of PEG(5)-BP-USPIO: (A) Plot of the relaxation rates (R1= 1/T1) as a function of Fe concentration showing the r1 relaxivities of PEG(5)-BP-USPIO (black circles, 9.5 mM–1 s–1) and Feraspin XS (gray triangles, 5.4 mM–1 s–1); (B) Phantom MRI images (grayscale, left; color scale, right) of PEG(5)-BP-USPIO showing the concentration-dependent effect in T1- (top) and T2- (bottom) weighted sequences. The arrow indicates the most concentrated vial (5.3 mM Fe) and the concentration decreases anticlockwise, with the last vial containing water only.