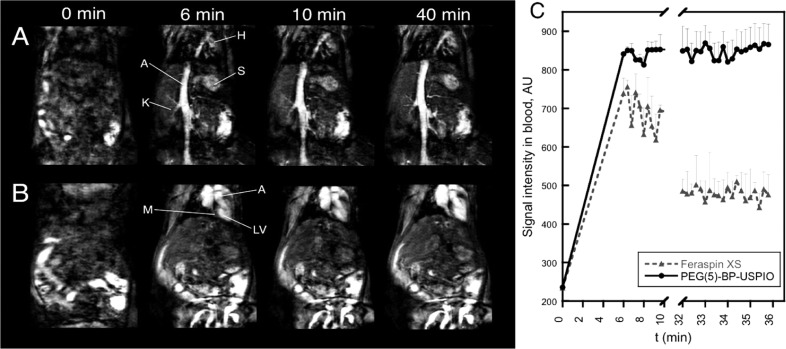
Figure 5.
In vivo MRI studies with PEG(5)-BP-USPIO: (A, B) T1-weighted images showing the increase in signal from blood in the vessels (A) and the heart (B) at different time points (t = 0 min, pre-injection). Labels: H = heart, S = spleen, K = kidney, A = aorta, M = myocardium, LV = left ventricle. (C) Kinetic profile of the MRI signal intensity in blood obtained from PEG(5)-BP-USPIO (black circles, 10 μmol Fe/kg dose) and Feraspin XS (gray triangles, 40 μmol Fe/kg dose).

