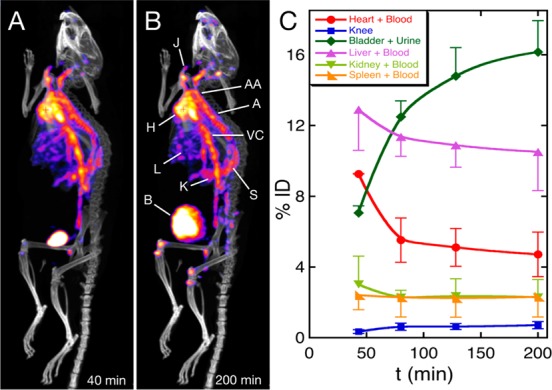
Figure 6.

In vivo SPECT-CT studies with PEG(5)-BP-USPIO: (A, B) Maximum intensity projection SPECT-CT images after iv injection of radiolabeled (99mTc) PEG(5)-BP-USPIO at the first (A, 40 min) and last (B, 200 min) time points. (Labels: H = heart, J = jugular vein, AA = aortic arch, A = aorta, VC = vena cava, L = liver, K = kidney, S = spleen, B = bladder). (C) Pharmacokinetic profile as obtained by quantification of the signal from several tissues showing the changes in the percentage of the injected dose (% ID) as a function of time. Data represent the mean ± SD (n = 2 mice).
