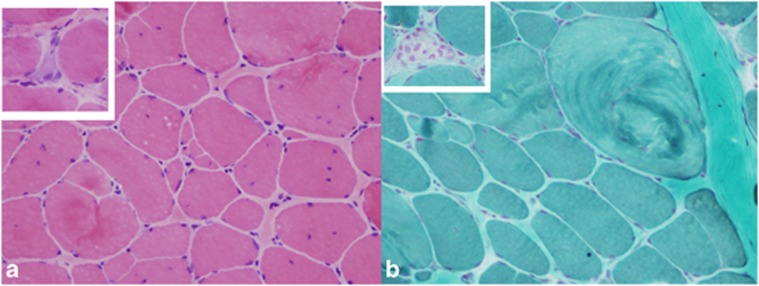
Figure 2.
(a) H&E stain showing moderate variation in fiber size, fiber splits, increased internalized nuclei and mild increase in the endomysial connective tissue. Inset shows regenerating fibers. (b) Modified Gomori trichrome stain showing a whorled hypertrophic fiber. Inset shows focal phagocytosis. Magnification × 200.

