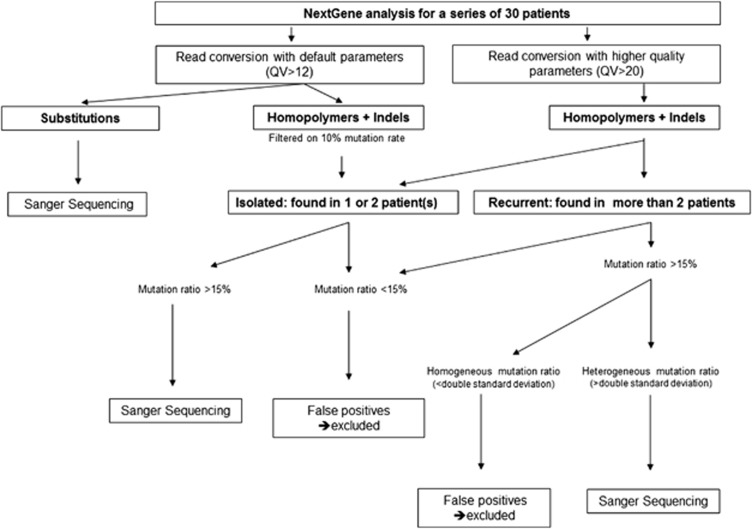
Figure 1.
Decision tree for NextGene analysis for series of 30 patients. Two distinct analyses are run with distinct read quality values (QV, ie, a Phred-based score) to address homopolymer regions. True homopolymer variants are found in one patient only and/or in several patients, but as outliers as compared to the false positives (>double standard deviation). Analyses are automatically launched and processed in about 2 h. See text for details.

