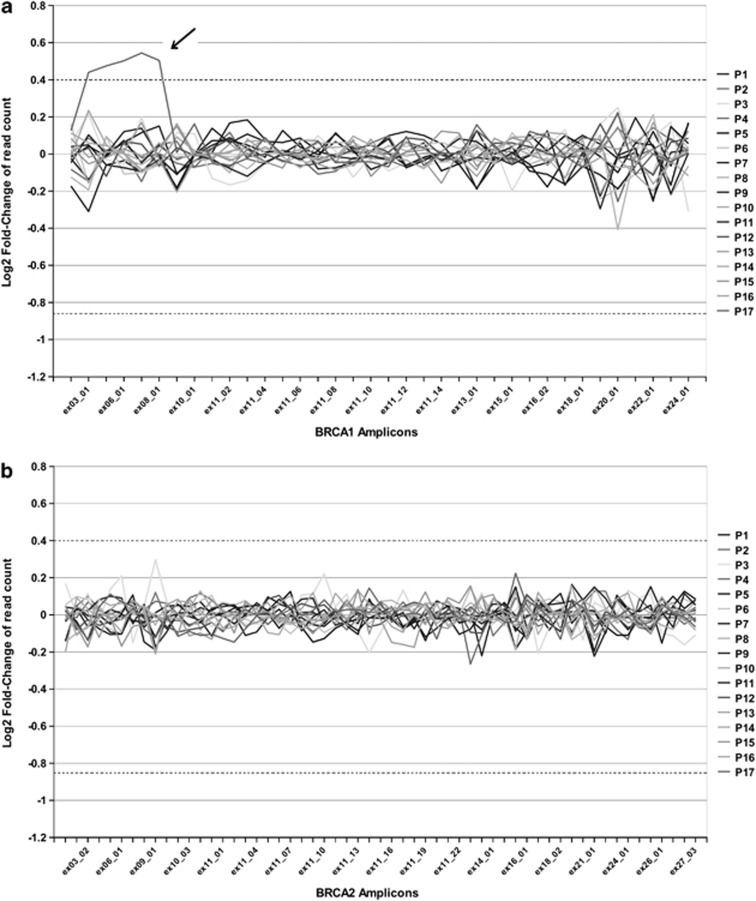
Figure 3.
Graphical representation of large rearrangement analysis using the academic pipeline. The differential analysis of read counts in BRCA amplicons of 17 different patients is shown. Each line represents a patient. x axis: amplicons under study, y axis: Log2 fold-change ratios. The thresholds for exonic deletions (<−0.85, ie, 1.8-fold decrease) or duplications (>0.4, ie, 1.3-fold increase) are indicated by dotted lines. (a) Detection of a duplication from exons 3 to 8 of BRCA1 (arrow). (b) Results for the same patients on BRCA2: no rearrangements were detected.

