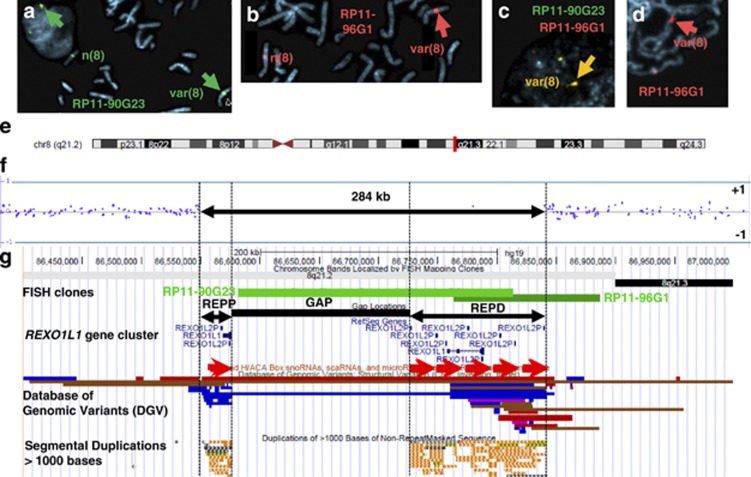
Figure 2.
(a–e) FISH and microarray results: (a, b) single-colour FISH with BACs RP11-90G23 (green) and BAC RP11-96G1 (red) in metaphases and an interphase nucleus from Patient 1 with the variant chromosome indicated by the large arrows; (c) dual-colour FISH with BACs RP11-90G23 (green) and RP11-96G1 (red) in an interphase nucleus from Patient 1 showing the colocalisation of the combined signals (yellow); (d) FISH with BAC RP11-96G1 (red) in a prometaphase from Patient 1 showing the lack of separation of the signals on the variant chromosome; (e) idiogram of chromosome 8 showing the location of the CNV region in distal 8q21.2; (f) Affymetrix Cytoscan HD array analysis of base pairs 86 460 508–87 259 456 in Patient 4 using the Affymetrix ChAS Software. The normal copy number results cluster along the horizontal weighted log2 ratio=0 line and flank the variant 284 kb region between base pairs 86 553 129 and 86 836 909 (hg19). The horizontal lines above and below represent log2 ratios of +1 and −1, respectively. (g) A Portable Document Format (PDF) screen shot of the variant and flanking regions of 8q21.2 from the UCSC browser (GRCh37/hg19). The FISH clones are in green with RP11-90G23 manually annotated from BAC end sequence data (base pairs 86 570 255–86 817 480). The flanking SDs are represented by black double-headed arrows between black vertical lines and have been labelled REPP (for REPeat Proximal) and REPD (for REPeat Distal). The sequence gap between the SDs is represented by the black bar labelled GAP. The RefSeq genes are in blue with the tandem REXO1L1 gene array highlighted by the red arrows underneath. The region contains no non-coding sequences. The DGV tracks show gains (blue), losses (red) and inversions (brown). The UCSC SD track is mostly in terracotta.

