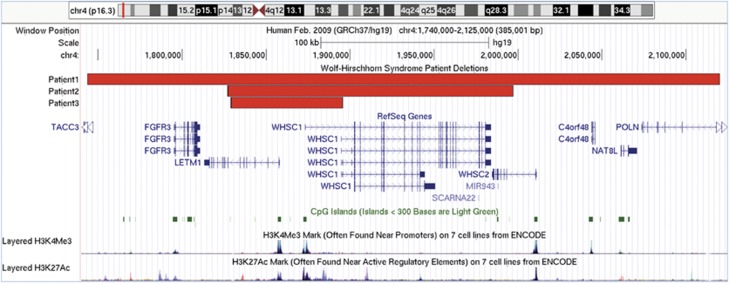
Figure 3.
Genomic region of 4p16.3 involved in the deletions of patients 1–3. Snapshot of genomic region 1.740–2.125 Mb of chr. 4 displayed using the UCSC genome browser (GRCh37/hg19) showing the location of deletions of patients 1–3. The RefSeq Genes track shows the mapped location and exon/intron structure of gene transcripts from the NCBI RNA reference sequences collection of known protein-coding (dark-colored) and non-protein-coding (light-colored) genes. Non-coding exons are displayed as half the height of coding exons and the direction of transcription with arrowheads. The CpG islands track shows the location of predicted clusters of methylated CG dinucleotides, which are common near transcription start sites and may be associated with promoter regions. The ENCODE layered H3K4Me3 and H3K27Ac tracks show the location and levels of enrichment of H3K4Me3 and H3K27Ac histone marks, which are molecular correlates of promoters and enhancers, respectively.

