
Figure 3.
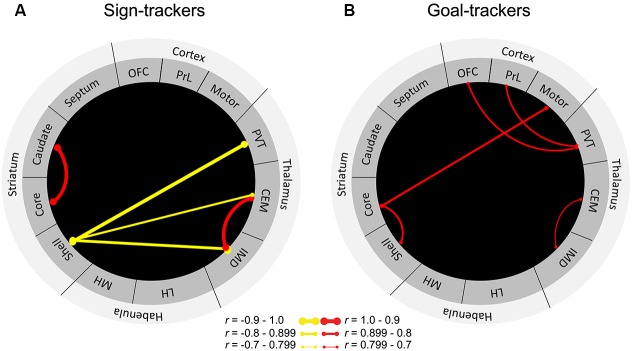
“Functional connectivity” in sign-trackers and goal-trackers. Illustration of significantly correlated levels of c-fos mRNA expression between brain regions for (A) sign-trackers and (B) goal-trackers. Red lines are indicative of a significant positive correlation and yellow lines represent negative correlations. The thicker the line, the stronger the correlation. Abbreviations: OFC, orbitofrontal cortex; PrL, prelimbic cortex, PVT, paraventricular nucleus of the thalamus; CEM, centromedial nucleus of the thalamus; IMD, intermediodorsal nucleus of the thalamus; LH, lateral habenula; MH, medial habenula. Adapted from Flagel et al. (2011a).