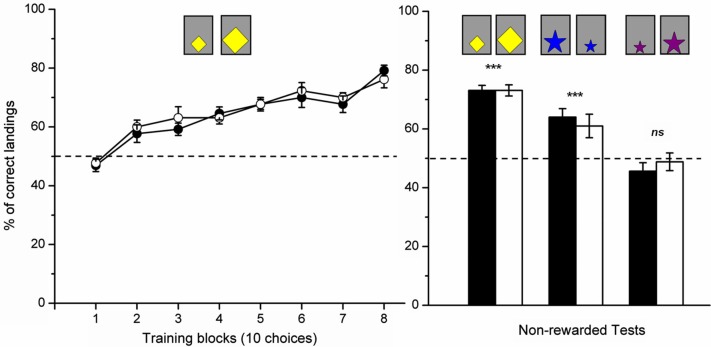
Figure 3.
Performance of the tested honeybees. Percentage of correct choices in the training (left panel) and tests (right panel) phases. Performance of the bees rewarded on the larger stimuli are presented in black while performance of the bees rewarded on the smaller stimuli are presented in white. The dashed line indicates chance level performance. Data shown are means +s.e.m. n = 26 for the acquisition curve and learning test. 10 of the 26 bees were tested in the “blue stars transfer test” while the others were tested in the “violet stars transfer test” (***: p < 0.001; n.s: p > 0.05).

