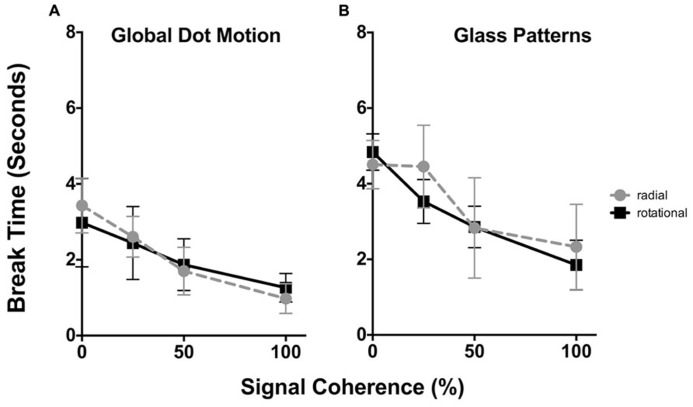
FIGURE 2.
The time taken (in seconds) for GDM (A) and static Glass patterns (B) to break CFS suppression plotted as a function of the signal coherence (%). In each plot radial patterns are represented by circles, while rotational data is given by squares. Error bars signify 95% confidence intervals. For both GDM and static Glass patterns increasing signal coherence caused both patterns to break suppression faster. Note that overall break times for static Glass patterns were higher than GDM patterns.

