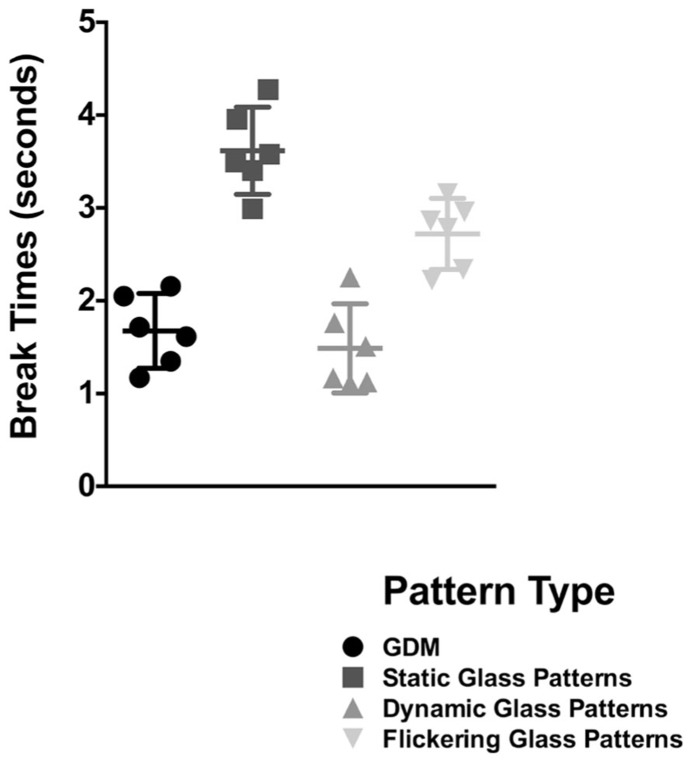
FIGURE 3.
Break times for GDM, static-, dynamic-, and flickering- Glass patterns as bar graphs. Error bars represent 95% confidence intervals. Break times for a form-static flickering Glass patterns were lower than a continuous pattern, but were slower than GDM and dynamic Glass patterns which contain global motion.

