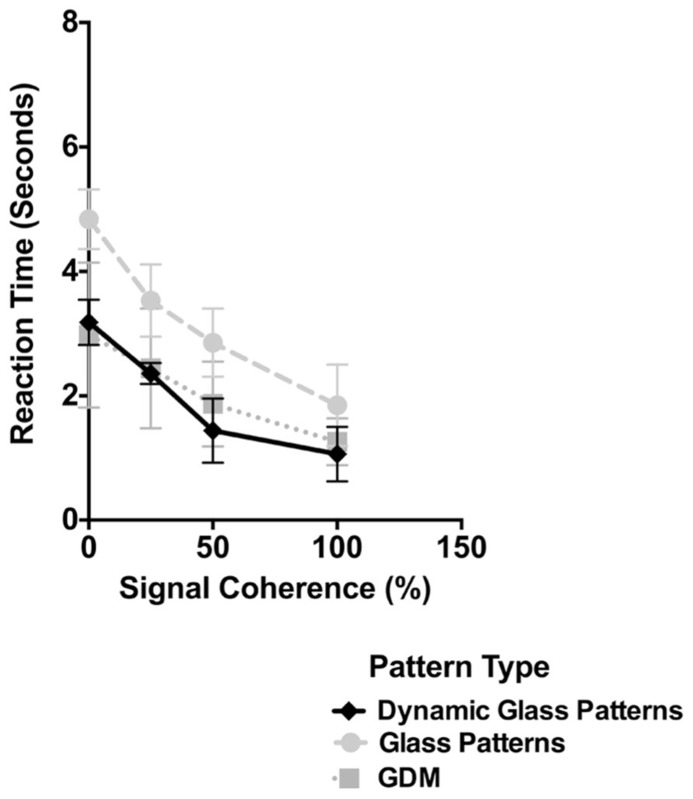
FIGURE 4.
The time taken for dynamic Glass patterns to break suppression (diamonds) is plotted as a function of the coherence of the stimulus. Error bars represent 95% confidence intervals. Plotted for comparison are the data for GDM and Glass pattern stimuli from Experiment 1. Break times for dynamic Glass patterns decreased with signal coherence in a similar manner to those observed with GDM patterns.

