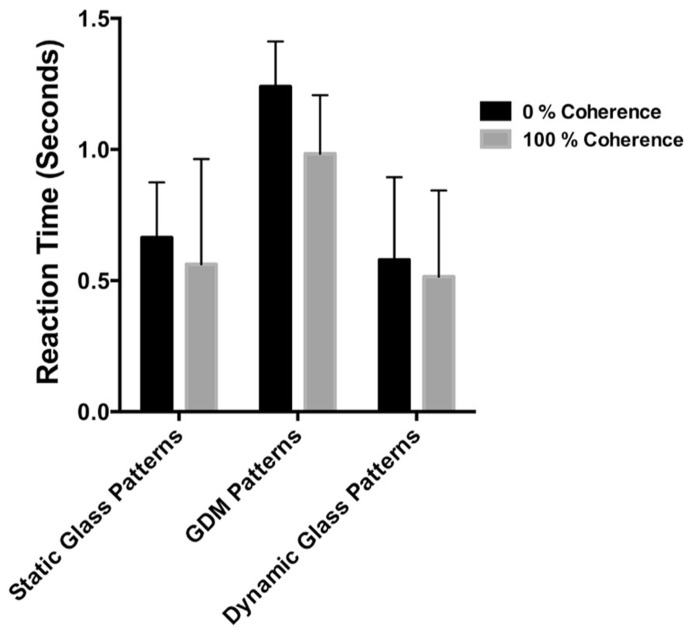
FIGURE 6.
The time taken to detect the stimulus from a dynamic background plotted for different pattern types. Black bars represent conditions in which the pattern was 0% coherent, while gray bars the coherence level was 100%. Errors signify 95% confidence intervals. Detection times were different between pattern types, but not between highly coherent patterns compared to random patterns.

