
Fig. 2.
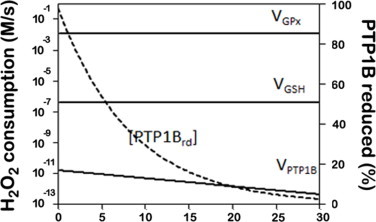
PTP1B signaling by H2O2 when in the presence of an antioxidant kinetic bottleneck that outcompetes the rate of PTP1B oxidation.The following reactions were included: a rate of H2O2 production of 1.2 × 10⁻² M s−1; H2O2 consumption via glutathione peroxidase (VGPx = kGPx × [GPx] × [H2O2]), via PTP1B (VPTP1B = kPTP1b× [PTP1Brd] × [H2O2]) and via non-enzymatic reaction with GSH (VGSH = kGSH × [GSH] × [H2O2]). kGPx = 6 × 10⁷ M−1 s−1, [GPx] = 2 × 10⁻⁶ M, kPTP1b = 20 M−1 s−1, [PTP1Btot] = 8.3 × 10⁻⁹ M, kGSH = 0.87 M−1 s−1, [GSH] = 5 × 10⁻³ M. With these parameters, the steady state obtained was [H2O2] = 1 × 10⁻⁴ M. [PTP1Btot] = [PTP1Brd] + [PTP1Box], where the subscripts tot, rd and ox, refer to the total amount of PTP1B, to the reduced and to the oxidized forms of PTP1B, respectively.