
Fig. 3.
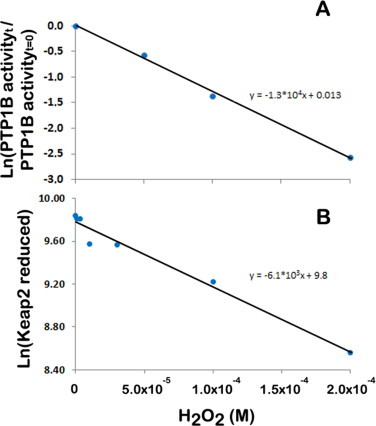
Application of Eq. (6) to estimate rate constants between cellular targets and H2O2. Plot of the fraction of PTP1B activity observed invitro after 10 min (A) and of the reduced form of KEAP1 observed in HeLa cells after 5 min (B) of incubation with the indicated H2O2 concentrations. Experimental data are taken from [33] and [189], respectively for PTP1B and KEAP1. If a simple exponential decay is considered, that is no regeneration of sensor occurs, the slope of these plots is ktarget + H2O2 × t (Eq. (6)) and, therefore, the rate constants between PTP1B and KEAP1 with H2O2 are estimated at 22 M−1 s−1 and 20 M−1 s−1, respectively. If a gradient between extracellular and intracellular H2O2 of 6.8 is considered in HeLa cells [42], the rate constant for H2O2 reaction with KEAP1 is estimated at 140 M−1 s−1.