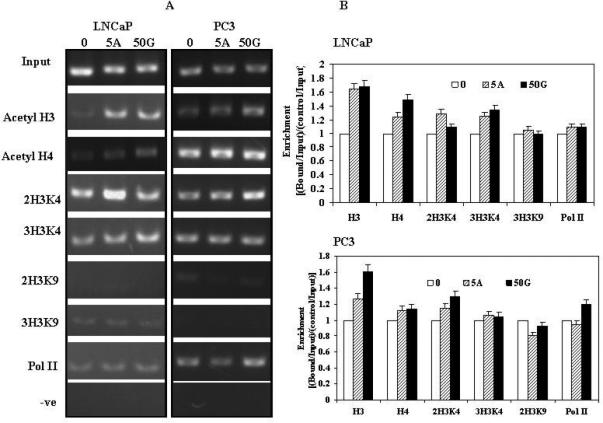
Figure 6.

A. Histone modifications. ChIP assay was performed on cells after treatment with 50uM/L genistein and 5uM/L 5Aza-C. Untreated control (0), 5Aza-C (5A), 50uM Genistein (50G). B. Data calculated from the corresponding DNA fragments amplified by PCR at annealing temperature of 60°C for a total of 28 cycles; bars, error ±SD. Enrichment was calculated as the ratio between the net intensity of each bound sample normalized to its input sample and the vehicle control sample normalized to vehicle control input samples (Bound sample/Bound sample Input)/(Vehicle control sample/Vehicle control Input).
