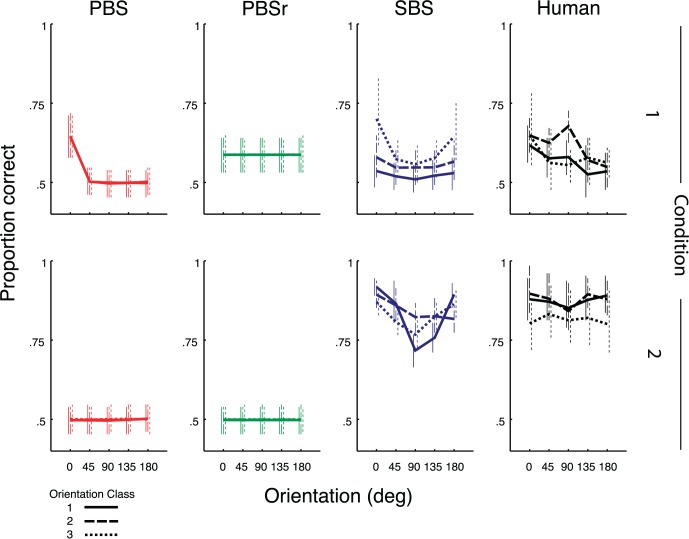
Figure 8.
Proportion of correct responses for each orientation class in each condition averaged across subjects plotted as a function of match and distractor orientation relative to the target. As predicted, there is an increment in proportion correct for the SBS model in Condition 1 as the orientation content of the images increases (from Class 1 to Class 3). Error bars show the SE derived by bootstrapping.

