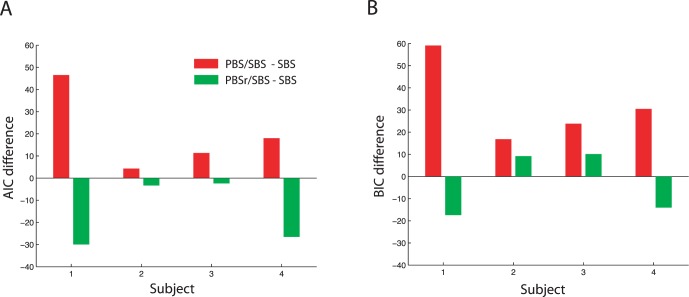
Figure 14.
(A) The AIC values derived by fitting the PBS and PBSr models to Condition 1, using the most salient regions, and SBS model to Condition 2 minus the AIC for the fit of the SBS model (using the entire image) to both conditions. Negative values in green indicate evidence for a dual strategy. (B) Differences in the BIC values between the dual models and SBS model. Positive values in green indicate lack of support for a dual strategy (see text).

