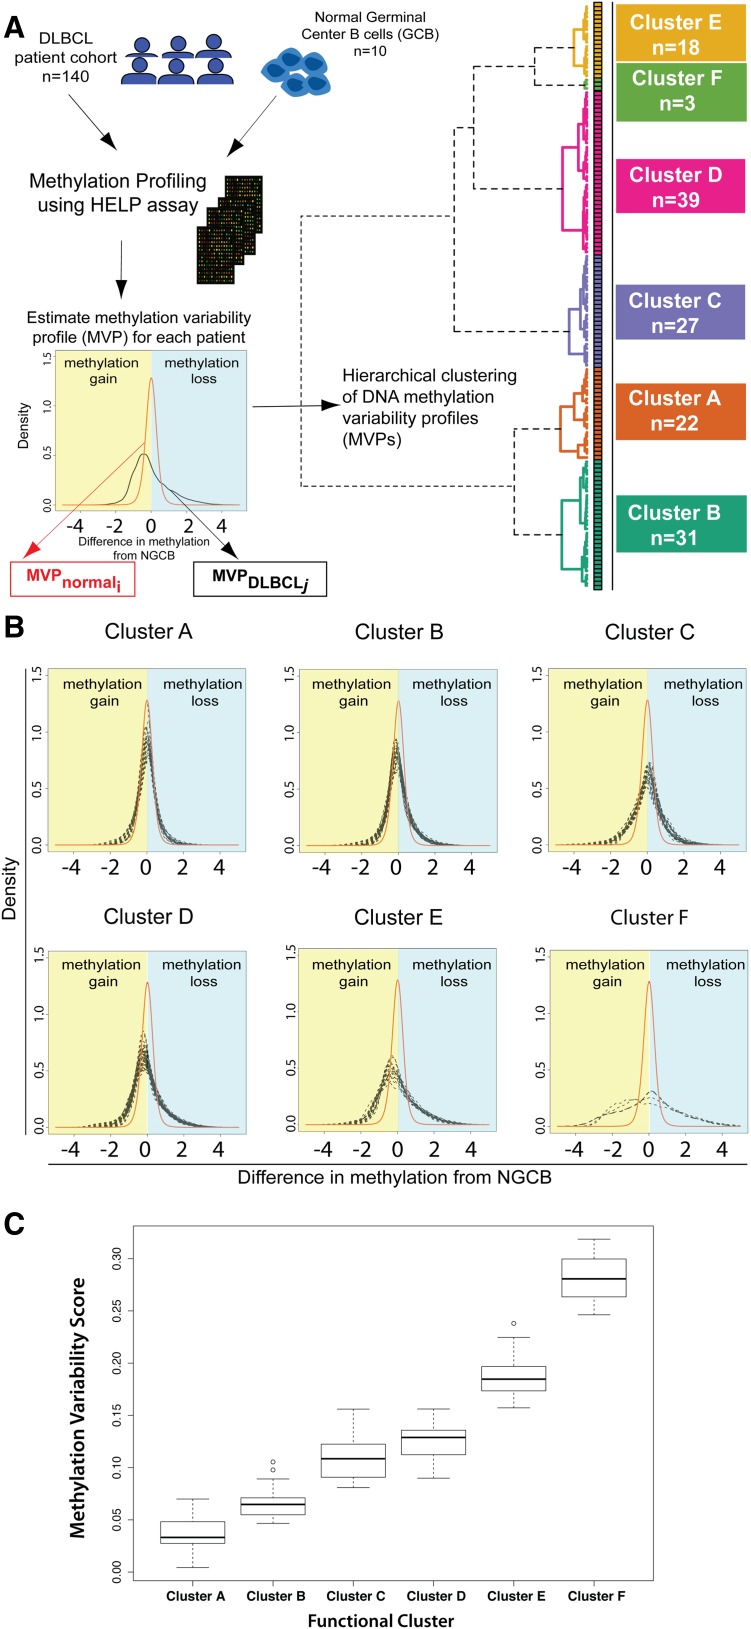
Figure 1.
Methylation variability defines 6 distinct clusters of DLBCL. (A) Outline of the study design and outcome of functional clustering. Samples were profiled for genomewide DNA methylation using the HELP array. For each sample, the MVP was determined. The MVPs were clustered using unsupervised functional hierarchical clustering to produce 6 distinct clusters in this cohort. (B) Cluster MVPs show increasing DNA methylation variability from the average NGCB methylation profile. Heavy right tails in the distribution indicate a tendency toward hypomethylation, whereas heavy left tails indicate hypermethylation in DLBCLs. (C) Boxplot representation of MVS by cluster shows increasing MVS from cluster A to cluster F.

