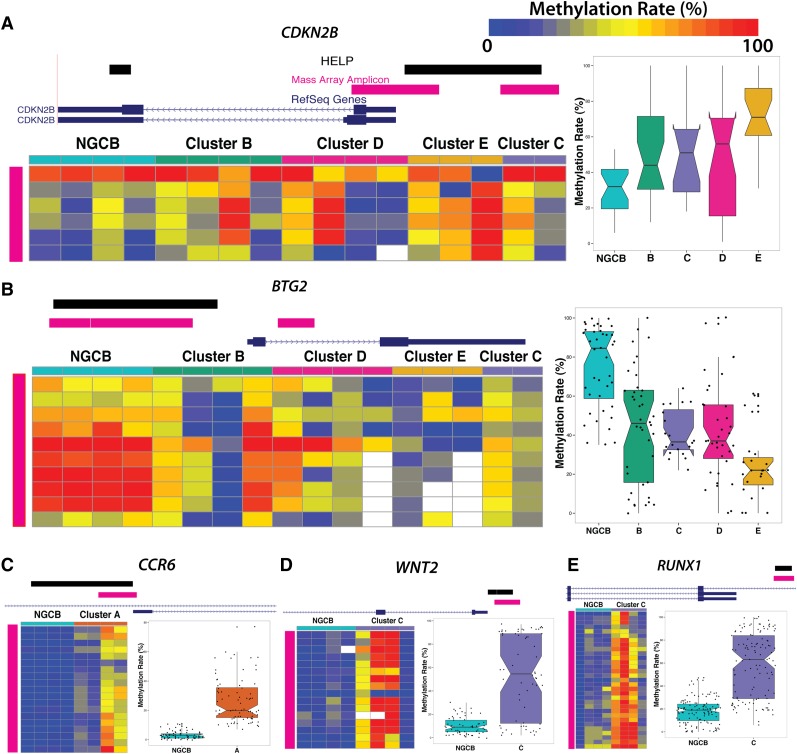
Figure 4.
Technical validation of differentially methylated loci. MassARRAY EpiTYPER results are shown for (A) CDKN2B, (B) BTG2, (C) CCR6, (D) WNT2, and (E) RUNX1. In each panel, the genome plots show the location of the HELP locus (black). The pink genome track shows the region assayed by MassARRAY. DLBCL samples were randomly selected as cluster representatives for validation (columns). Each row represents an individual genomic cytosine in the genomic region shown in the genome plot above the heat map (pink). Color intensity from blue to red represents the methylation rate (0%-100%). The boxplots on the right depict the distribution of methylation rate by group for all cytosines in regions assayed by MassARRAY.

