
Figure 6.
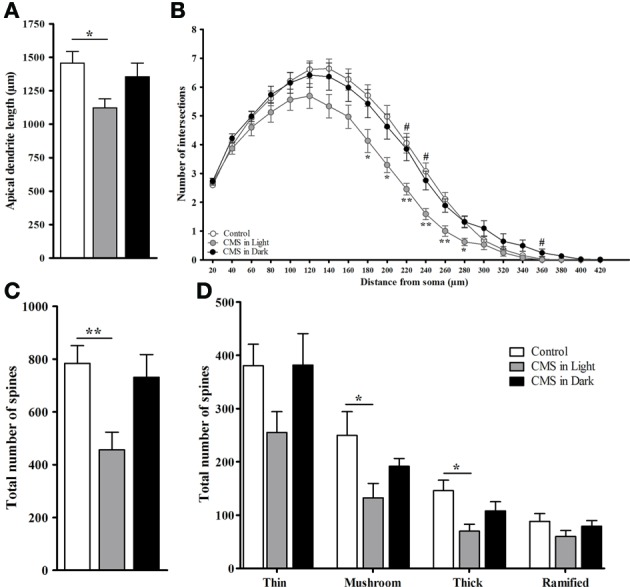
Morphometric analysis of dendritic arborizations in the hippocampal dentate gyrus. (A) Total dendritic length. (B) Sholl analysis-derived distribution of dendrites. (C) Total number of spines. (D) Total number of different types of spines. Controls, n = 20, each CMS group, n = 14; *P < 0.05. **P < 0.01. #P < 0.05. Data presented as mean ± s.e.m. * and ** indicate significant differences between the CMS-Light and the CON group. # indicates a significant difference between the CMS-Light and the CMS-Dark group.