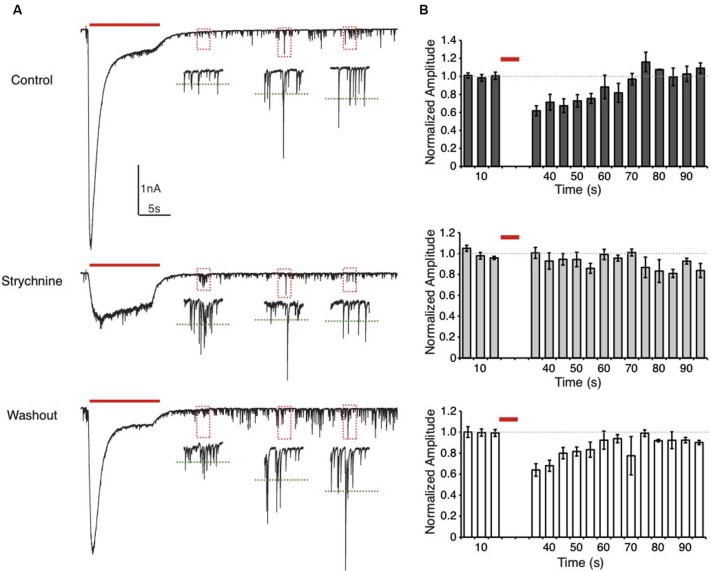
Figure 3.
Suppression of spontaneous IPSC (sIPSC) amplitudes after glycine application is eliminated by GlyR block. (A) Representative traces from an E20 NM neuron showing sIPSCs recorded during a glycine application protocol. Insets are expanded views of the sIPSCs in each dashed box. The green dashed lines represent the average sIPSC amplitude of the events within this two-second window. In the control condition (top) sIPSC amplitude is suppressed for a short time after glycine application. This effect was not observed during GlyR block (strychnine) but recovered after washout. Note that in the strychnine condition the GlyR block was often incomplete, but the large onset current was eliminated. (B) Histograms representing the normalized population data for the sIPSC amplitude analysis. Dashed line represents the average sIPSC amplitude before the glycine application. Each bin represents the average sIPSC amplitude during a 5 s time window. In the control and washout condition, sIPSC amplitude recovered to baseline values after approximately 35 s.

