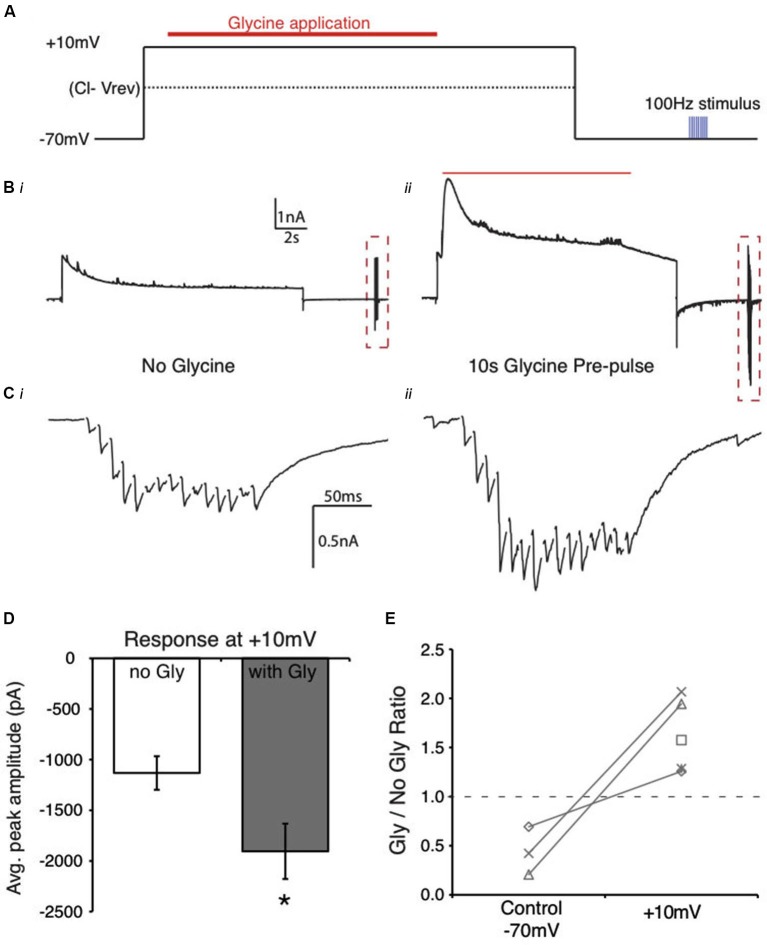
Figure 7.
Reversal of Cl− ion flow results in an enhanced evoked IPSC in NM. (A) Schematic of the flux reversal voltage clamp protocol. The membrane was held at approximately 45 mV positive to the Vrev Cl−. (B) Current response from an NM cell during the protocol in (A). (C) Expanded view of evoked responses from (B) (dashed box, stimulus artifacts blanked for clarity). Cii shows the increase in evoked response after glycine application while holding at +10 mV. (D) Average peak amplitudes of the evoked IPSCs in the control (no gly) and in the presence of glycine pre-application (* indicates significant difference, p < 0.01). (E) Ratio of peak amplitude between Gly/no Gly conditions in control and when glycine pre-pulse occurred at +10 mV. The ratios were >1 in each cell when glycine application occurred during the +10 mV voltage step. Dashed line represents a ratio of 1, indicating no change in evoked amplitude.

