Figure 8.
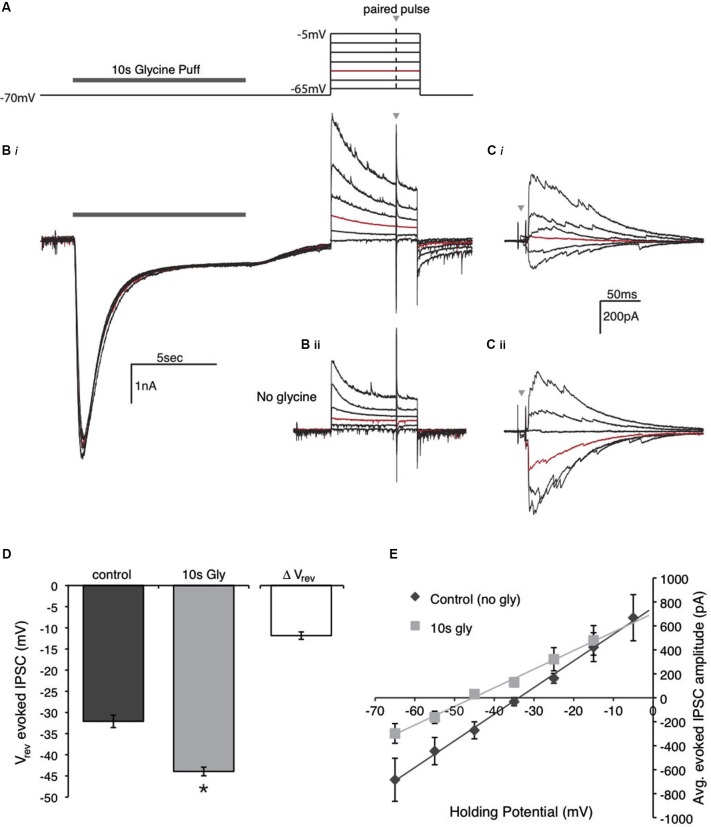
Glycine application affects the driving force of evoked IPSCs by shifting the reversal potential. (A) Schematic of the voltage clamp protocol used to compute reversal potential of evoked IPSCs. The protocol consisted of a paired pulse stimulus (gray arrow) to evoke IPSCs at various holding voltages in the presence or absence of the glycine pre-application. The highlighted (red) step at −45 mV is the voltage used for comparison in the Panels (B) and (C). (B) Raw data traces recorded during the protocol in (A) in the presence (Bi) and absence (Bii) the glycine pre-application. (C) Expanded view of the IPSCs evoked with a paired pulse stimulus during each voltage step. Note that the red trace (Vhold = −45 mV) in Ci has an evoked IPSC with outward current, while the IPSC in Cii is inward. (D) Population data for the average reversal potential in the control and glycine pre-application conditions (* indicates significant difference, p < 0.001, n = 7) as well as the average change in reversal potential between the conditions. (E) IV plot constructed by averaging the absolute peak IPSC amplitude of the paired pulse at each voltage step for the population of neurons tested.

