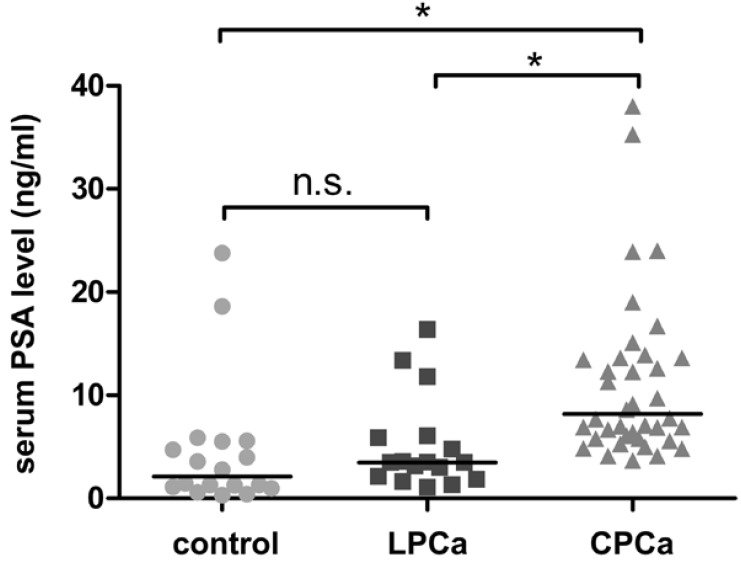
Figure 1.
The distribution of serum PSA level in control group, latent prostate cancer group (LPCa), and clinical prostate cancer group (CPCa), respectively. The data were statistically analyzed by Mann-Whitney’s U test (see Materials and Methods). Asterisks indicate significant differences (p < 0.0001). ‘n.s.’ indicates no significant difference.

