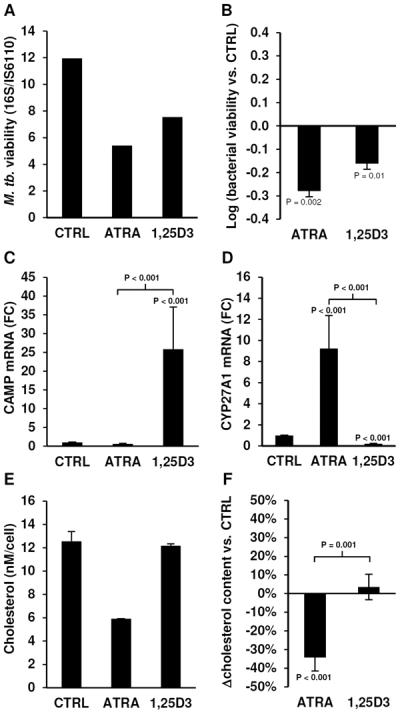
Figure 1.

ATRA- and 1,25D3-induced cellular responses. Bacterial viability of M. tuberculosis H37Ra infected primary monocytes treated with carrier control (CTRL), ATRA or 1,25D3 for three days displayed as (A) a representative experiment or (B) log10(mean bacterial viability vs. CTRL ± SEM), n = 4. mRNA expression levels assessed by qPCR of (C) cathelicidin (CAMP) and (D) CYP27A1 in primary human monocytes stimulated with CTRL, ATRA or 1,25D3 for 18 hours, displayed as mean fold change vs. CTRL ± SEM, n = 7. Cellular cholesterol levels per cell of monocytes treated with CTRL, ATRA or 1,25D3 for 18 hours shown as (E) a representative experiment or (F) mean percent change vs. CTRL ± SEM, n = 5.
